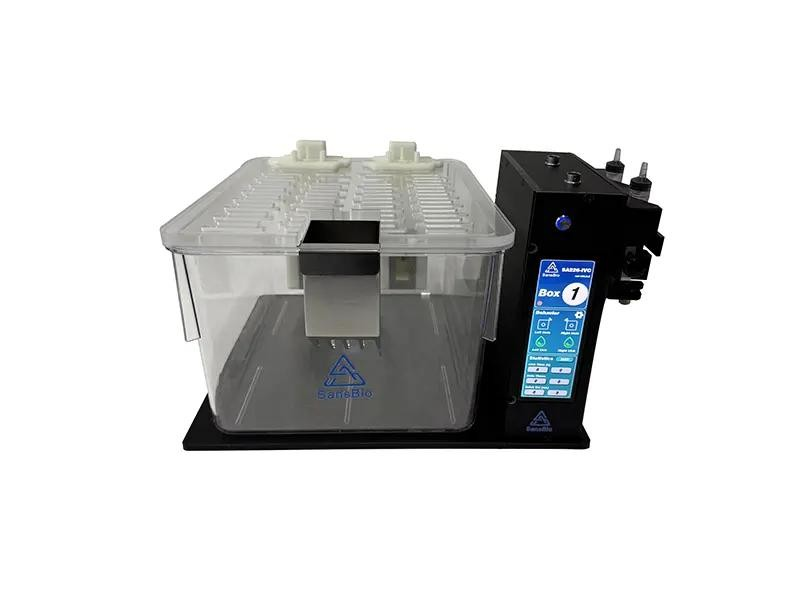
Sucrose preference percentage is a commonly used way to express how much sucrose solution an animal consumes relative to its total fluid intake. In a standard Sucrose Preference Test (SPT), rodents are offered sucrose solution and regular drinking water at the same time.
The resulting percentage can then be used alongside drinking volume and behavioral observations to examine changes in reward-related behavior and anhedonia-related phenotypes.
Start With the Two-Choice Intake Data
The calculation requires two measurements: the volume of sucrose solution consumed and the volume of regular water consumed during the same testing period. Because the percentage is based on both values, recording them over a consistent experimental interval is important for meaningful comparisons.
For example, if a mouse consumes 18 mL of sucrose solution and 6 mL of regular water, the total fluid intake is 24 mL. The sucrose solution therefore accounts for 75% of the total recorded intake.
The basic calculation is:
Sucrose preference percentage = sucrose solution consumption ÷ (sucrose solution consumption + water consumption) × 100%
This expresses sucrose consumption as a proportion of the animal’s combined intake rather than as an absolute volume.
Separate Preference From Total Fluid Intake
A high or low percentage does not by itself describe how much an animal drank overall. Two animals can have the same sucrose preference percentage while consuming different total volumes.
For example, one animal could consume 18 mL of sucrose solution and 6 mL of water, while another consumes 9 mL of sucrose solution and 3 mL of water. Both produce a 75% preference percentage, but their total fluid intake differs substantially.
For this reason, preference percentage is more informative when considered together with the underlying sucrose and water volumes. The SPT system records liquid volume for each drinking channel, allowing researchers to examine these measurements directly.
Keep the Experimental Context Consistent
Changes in sucrose preference should be interpreted within the conditions of the experiment. The SPT procedure provides sucrose water and regular drinking water simultaneously and records consumption during a defined testing period.
Baseline testing followed by an intervention and subsequent measurement is one possible experimental framework.
Researchers can therefore compare preference values across relevant experimental groups or time points while keeping the testing conditions as consistent as practical. Variables such as the testing period, available fluids, animal group, and experimental treatment should remain clear when interpreting differences.
Use the Percentage to Describe Behavioral Change
A decrease in sucrose preference can be associated with reduced interest in a palatable reward and is used in research involving anhedonia and depression-like behavior. However, the percentage should be treated as one behavioral measurement rather than an isolated description of the entire animal model.
Its listed applications include anhedonia and depression-like behavior, reward-system dysfunction, motivation changes, pharmacology, toxicology, and metabolic research. This broad application range means the interpretation should remain connected to the specific research question and experimental model.
Capture More Than a Single Percentage
Automated measurement can provide additional information beyond the final preference calculation. The Sucrose Preference Test system records drinking times, drinking duration, and liquid volume for two drinking-water statuses on each channel. Drinking time can be measured with 0.01-second accuracy, while drinking volume has a stated accuracy of 0.001 mL.
These measurements allow researchers to examine drinking behavior in greater detail instead of relying exclusively on the final sucrose preference percentage. The system also supports long-term testing and allows water changes during an experiment, which can be useful when the study design requires extended observation.
Scale the Measurement for Larger Studies
For experiments involving multiple animals or groups, measurement capacity can also influence the workflow. The software supports up to 200 channels, while each channel can record two drinking-water statuses simultaneously.
The system uses a micro syringe pump for precise sucrose-water and water delivery, with a stated filling accuracy of 0.01 mL.
The platform is also designed for separate channel operation and includes features such as one-click bottle changes and synchronization of drinking events with third-party devices through TTL signals. These functions provide additional options for studies that require automated monitoring or integration with other equipment.
Apply the Calculation to the Research Question
The sucrose preference percentage is straightforward to calculate, but its value depends on how the measurement is collected and interpreted. Start with the two underlying intake values, apply the same formula across comparable groups, and retain the raw sucrose and water measurements for additional analysis.
BioMed Easy Technologies develops laboratory animal and neuroscience research equipment. Its portfolio includes Food & Drink and Metabolism alongside other research categories, and its SPT solution combines automated drinking measurement with multi-channel testing and detailed behavioral data collection.
For laboratories evaluating automated sucrose preference measurement, the Sucrose Preference Test offers a way to collect drinking-volume and timing data while supporting larger experimental setups. Researchers can contact BioMed Easy to discuss configuration, technical support, and training when planning an SPT workflow.
